
Finnaly reach a state when the Datamine plugin for Vera can be available as beta test. As this is my first upload of plugin, not sure what the most efficient way is but I have uploaded a .hrp file (with 2 tiles, one image and a homegroup) and a plugin file. To install plugin in Home Remote Designer open the Datamine.betaV1.00.hrp file, right click on device folder->add plugin->import from file. In the form that pops up add:
- For local only the Host should be added.
- For remote enter Username, Password and SerialNumber.
Host is the control function for local access - as soon as host is listed it will use local connection.
When the Plugin form is done, hit OK and the plugin will install all channels in which have the logging enabled in Datamine2. From here, devices can be handled as regular devices with tile and detail tiles in groups - test it by adding devices to Homegroup.
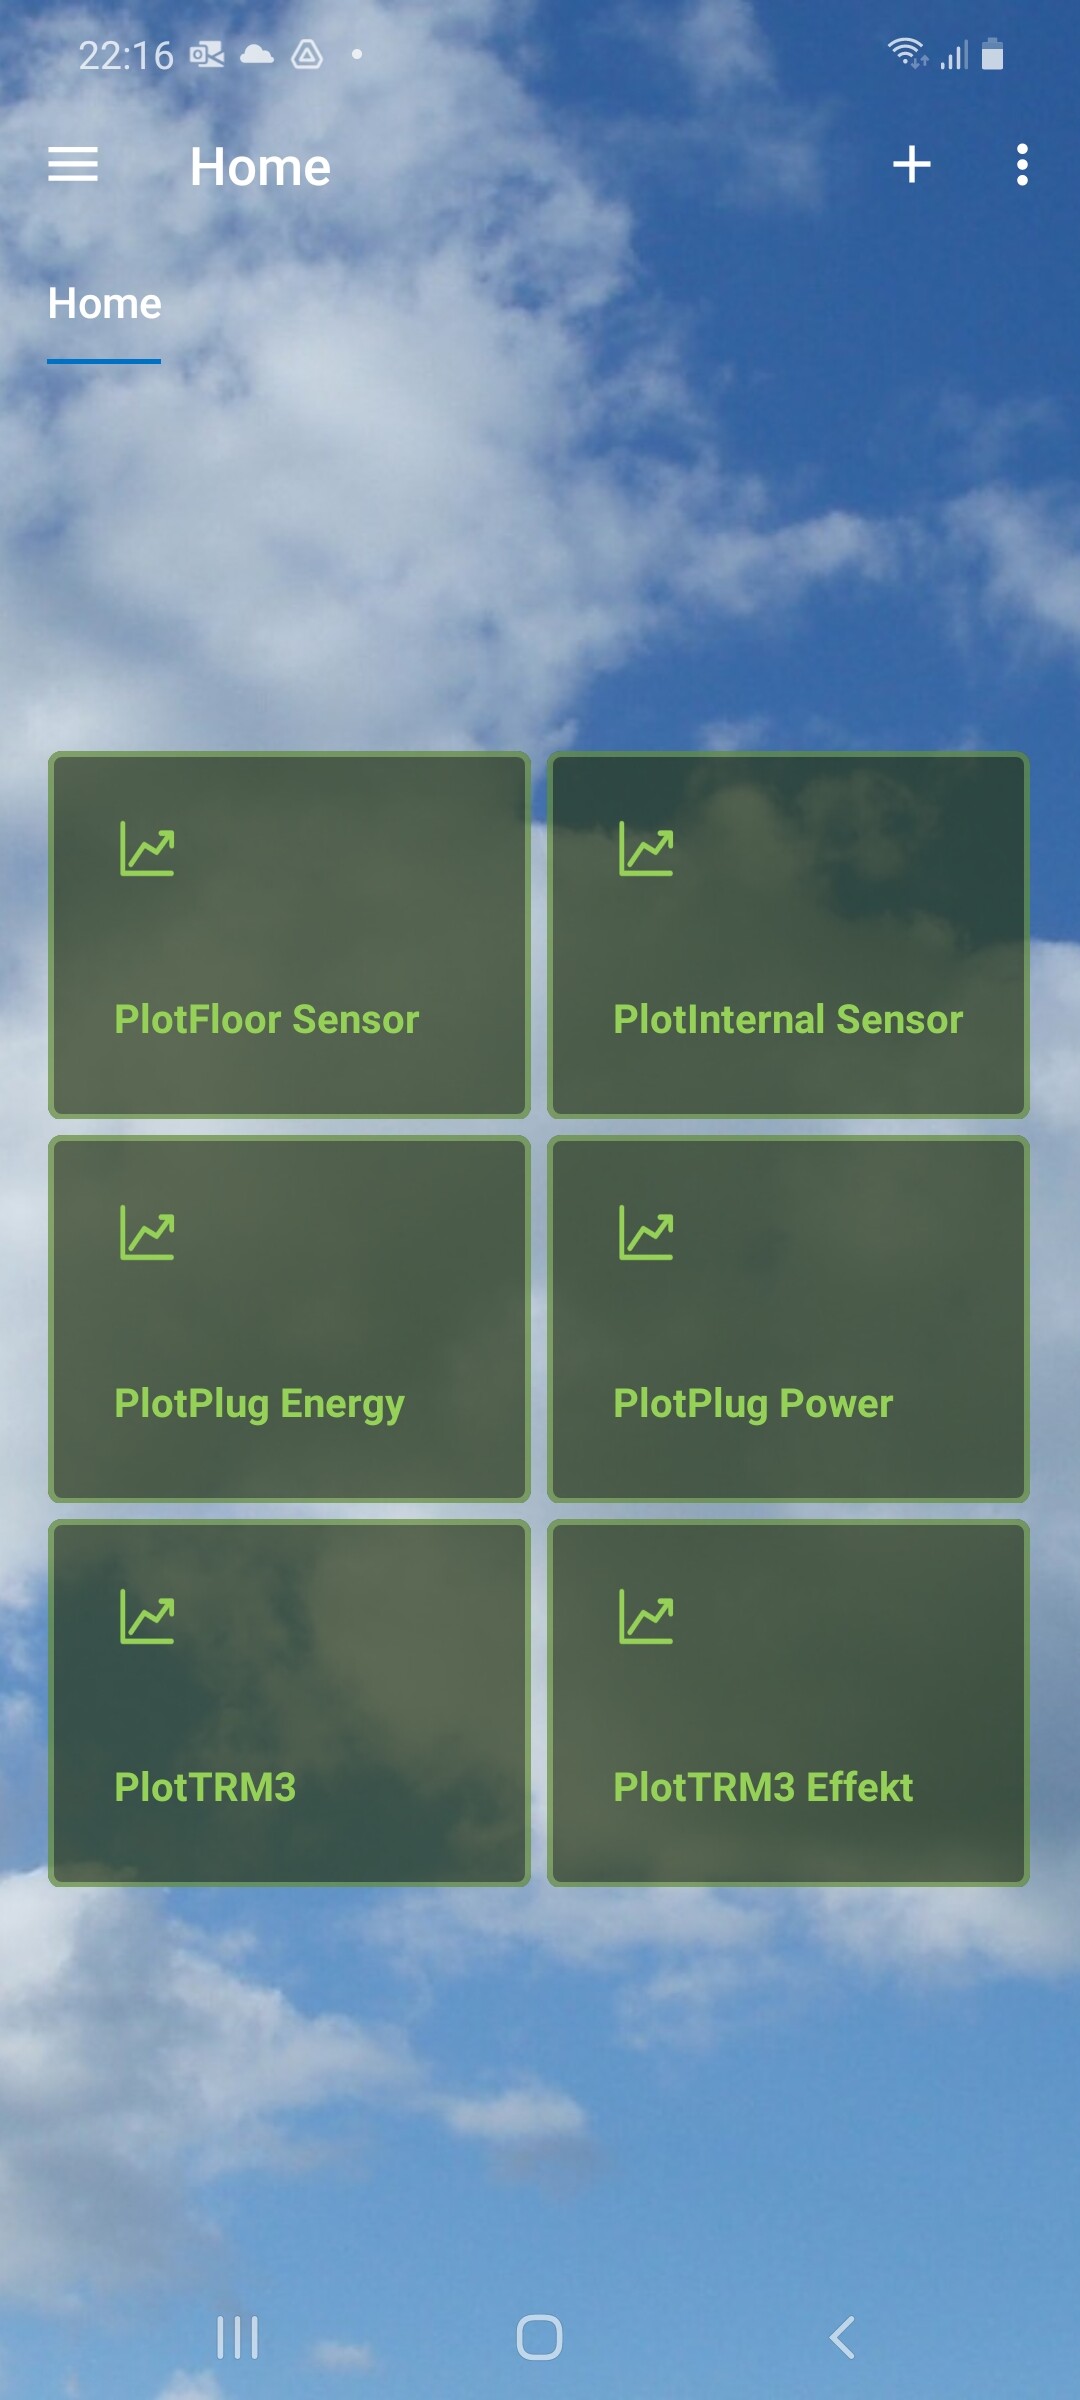
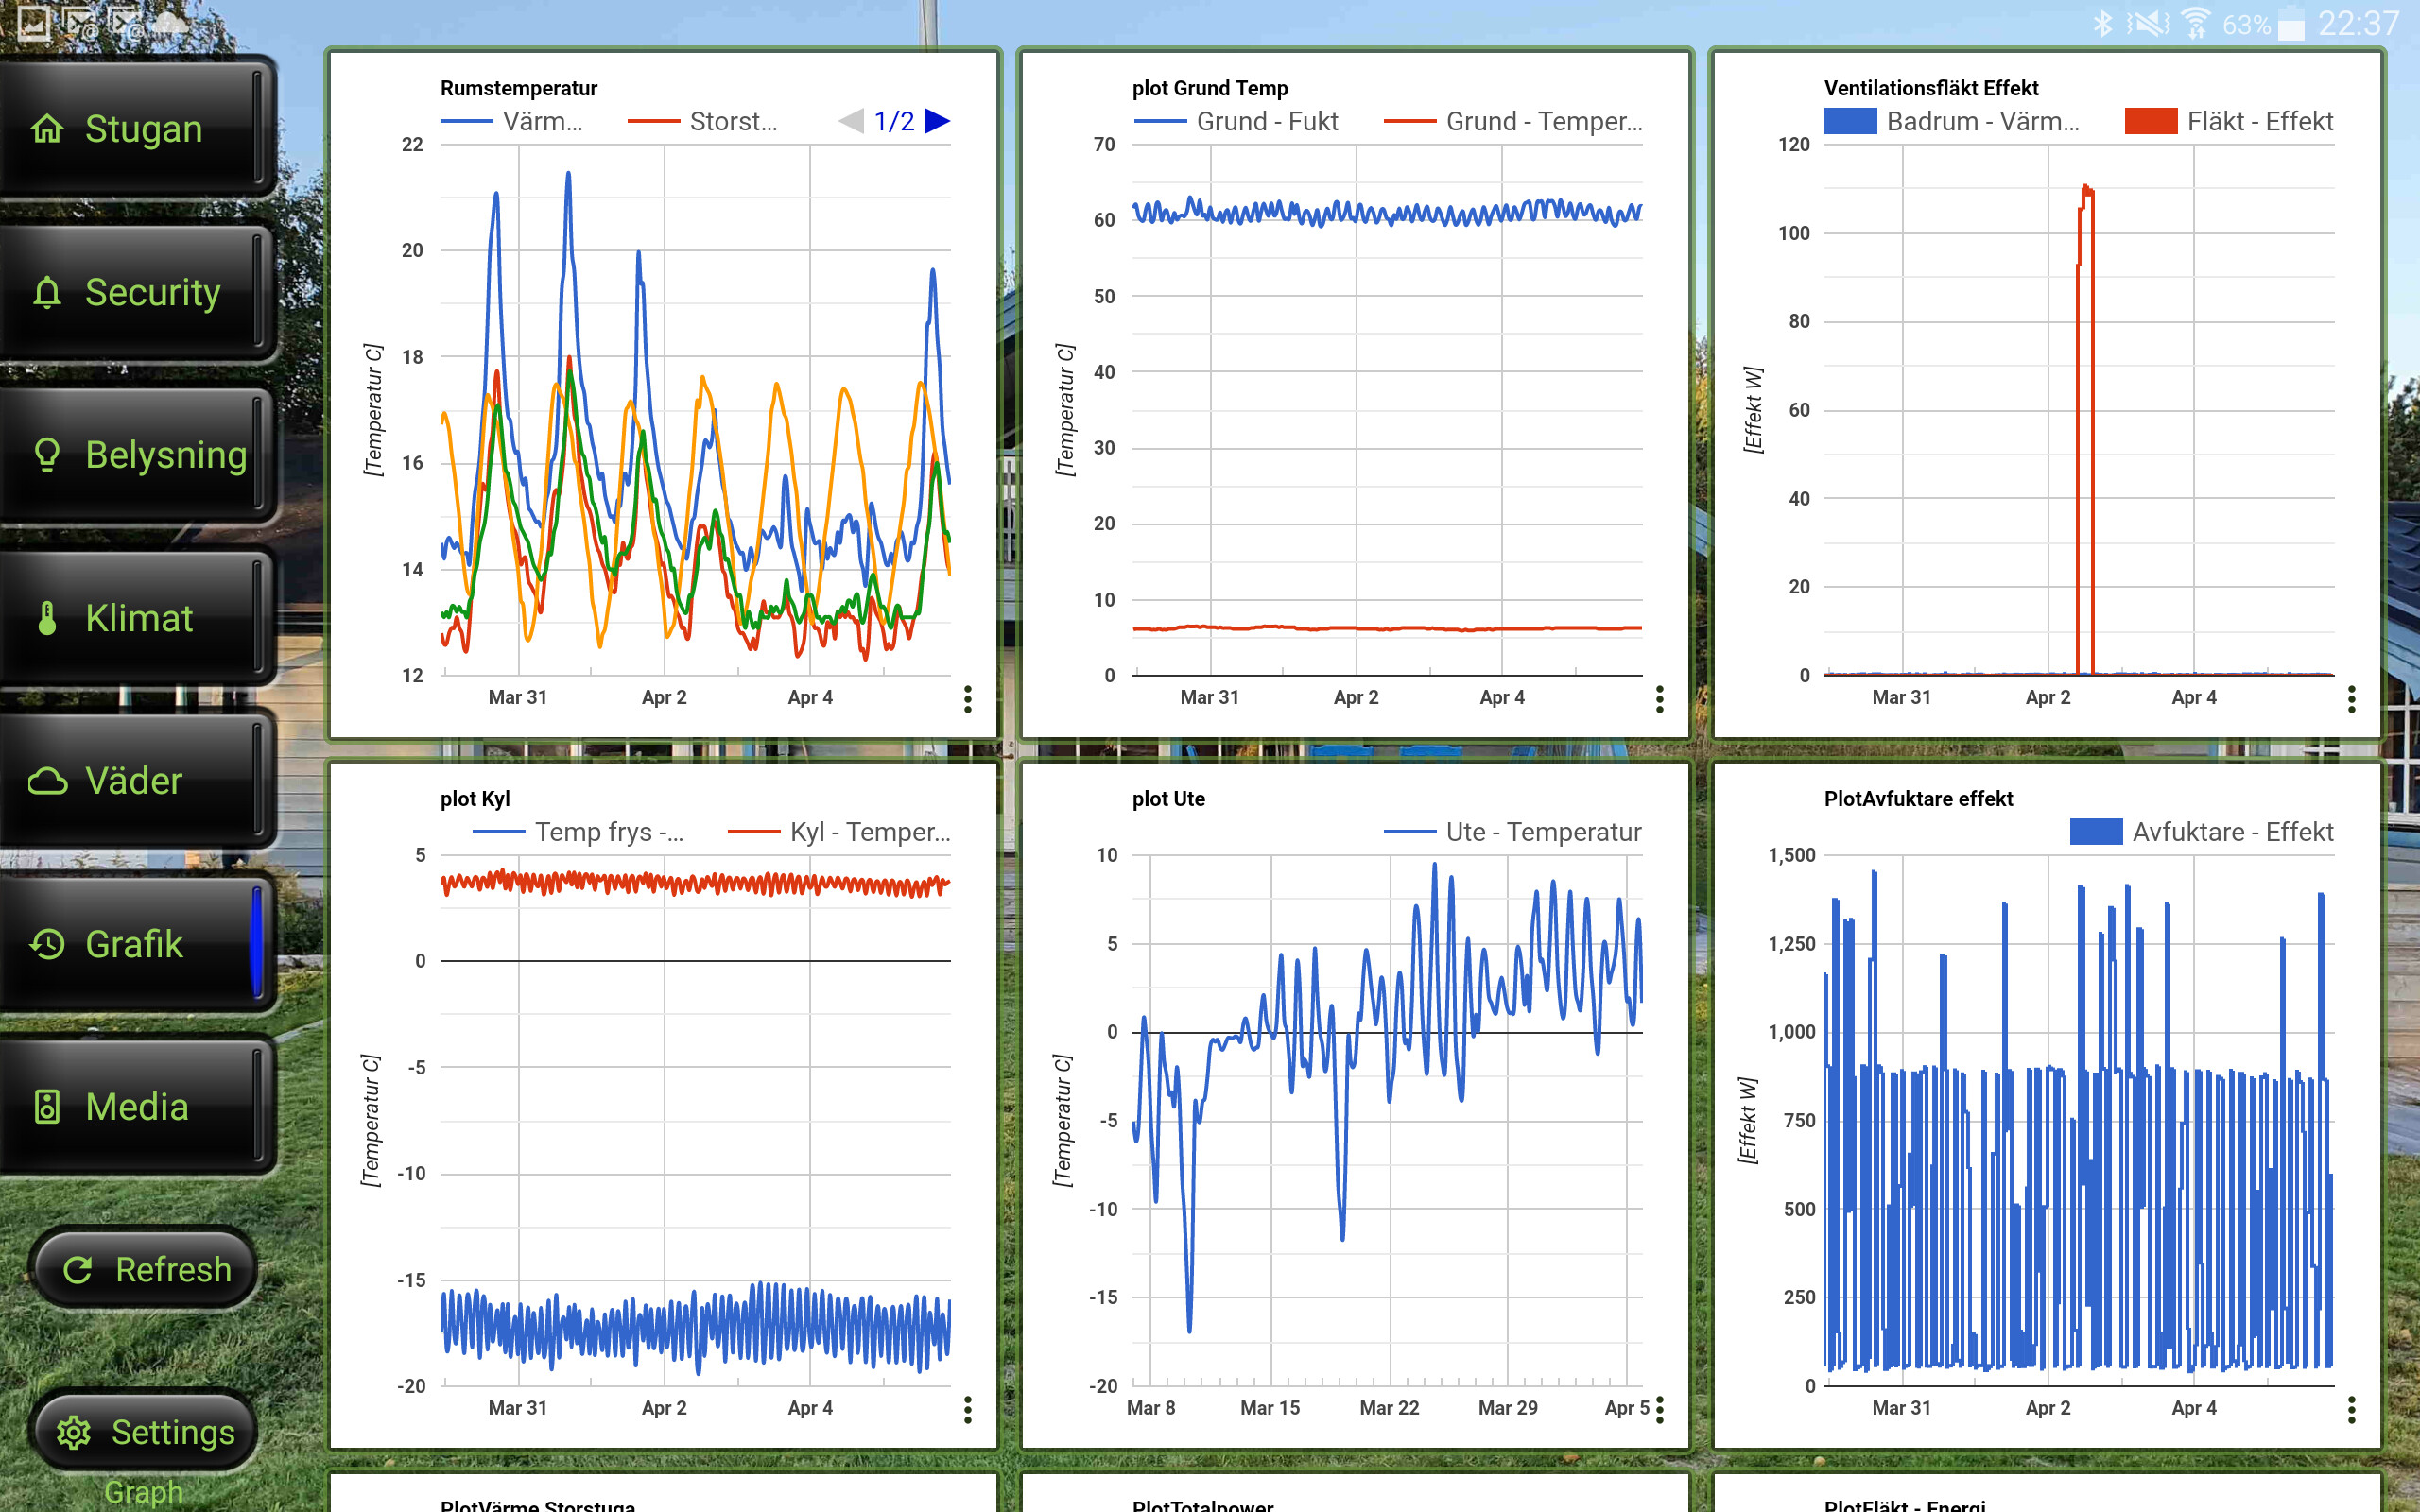
Here are some pictures when running in the app.

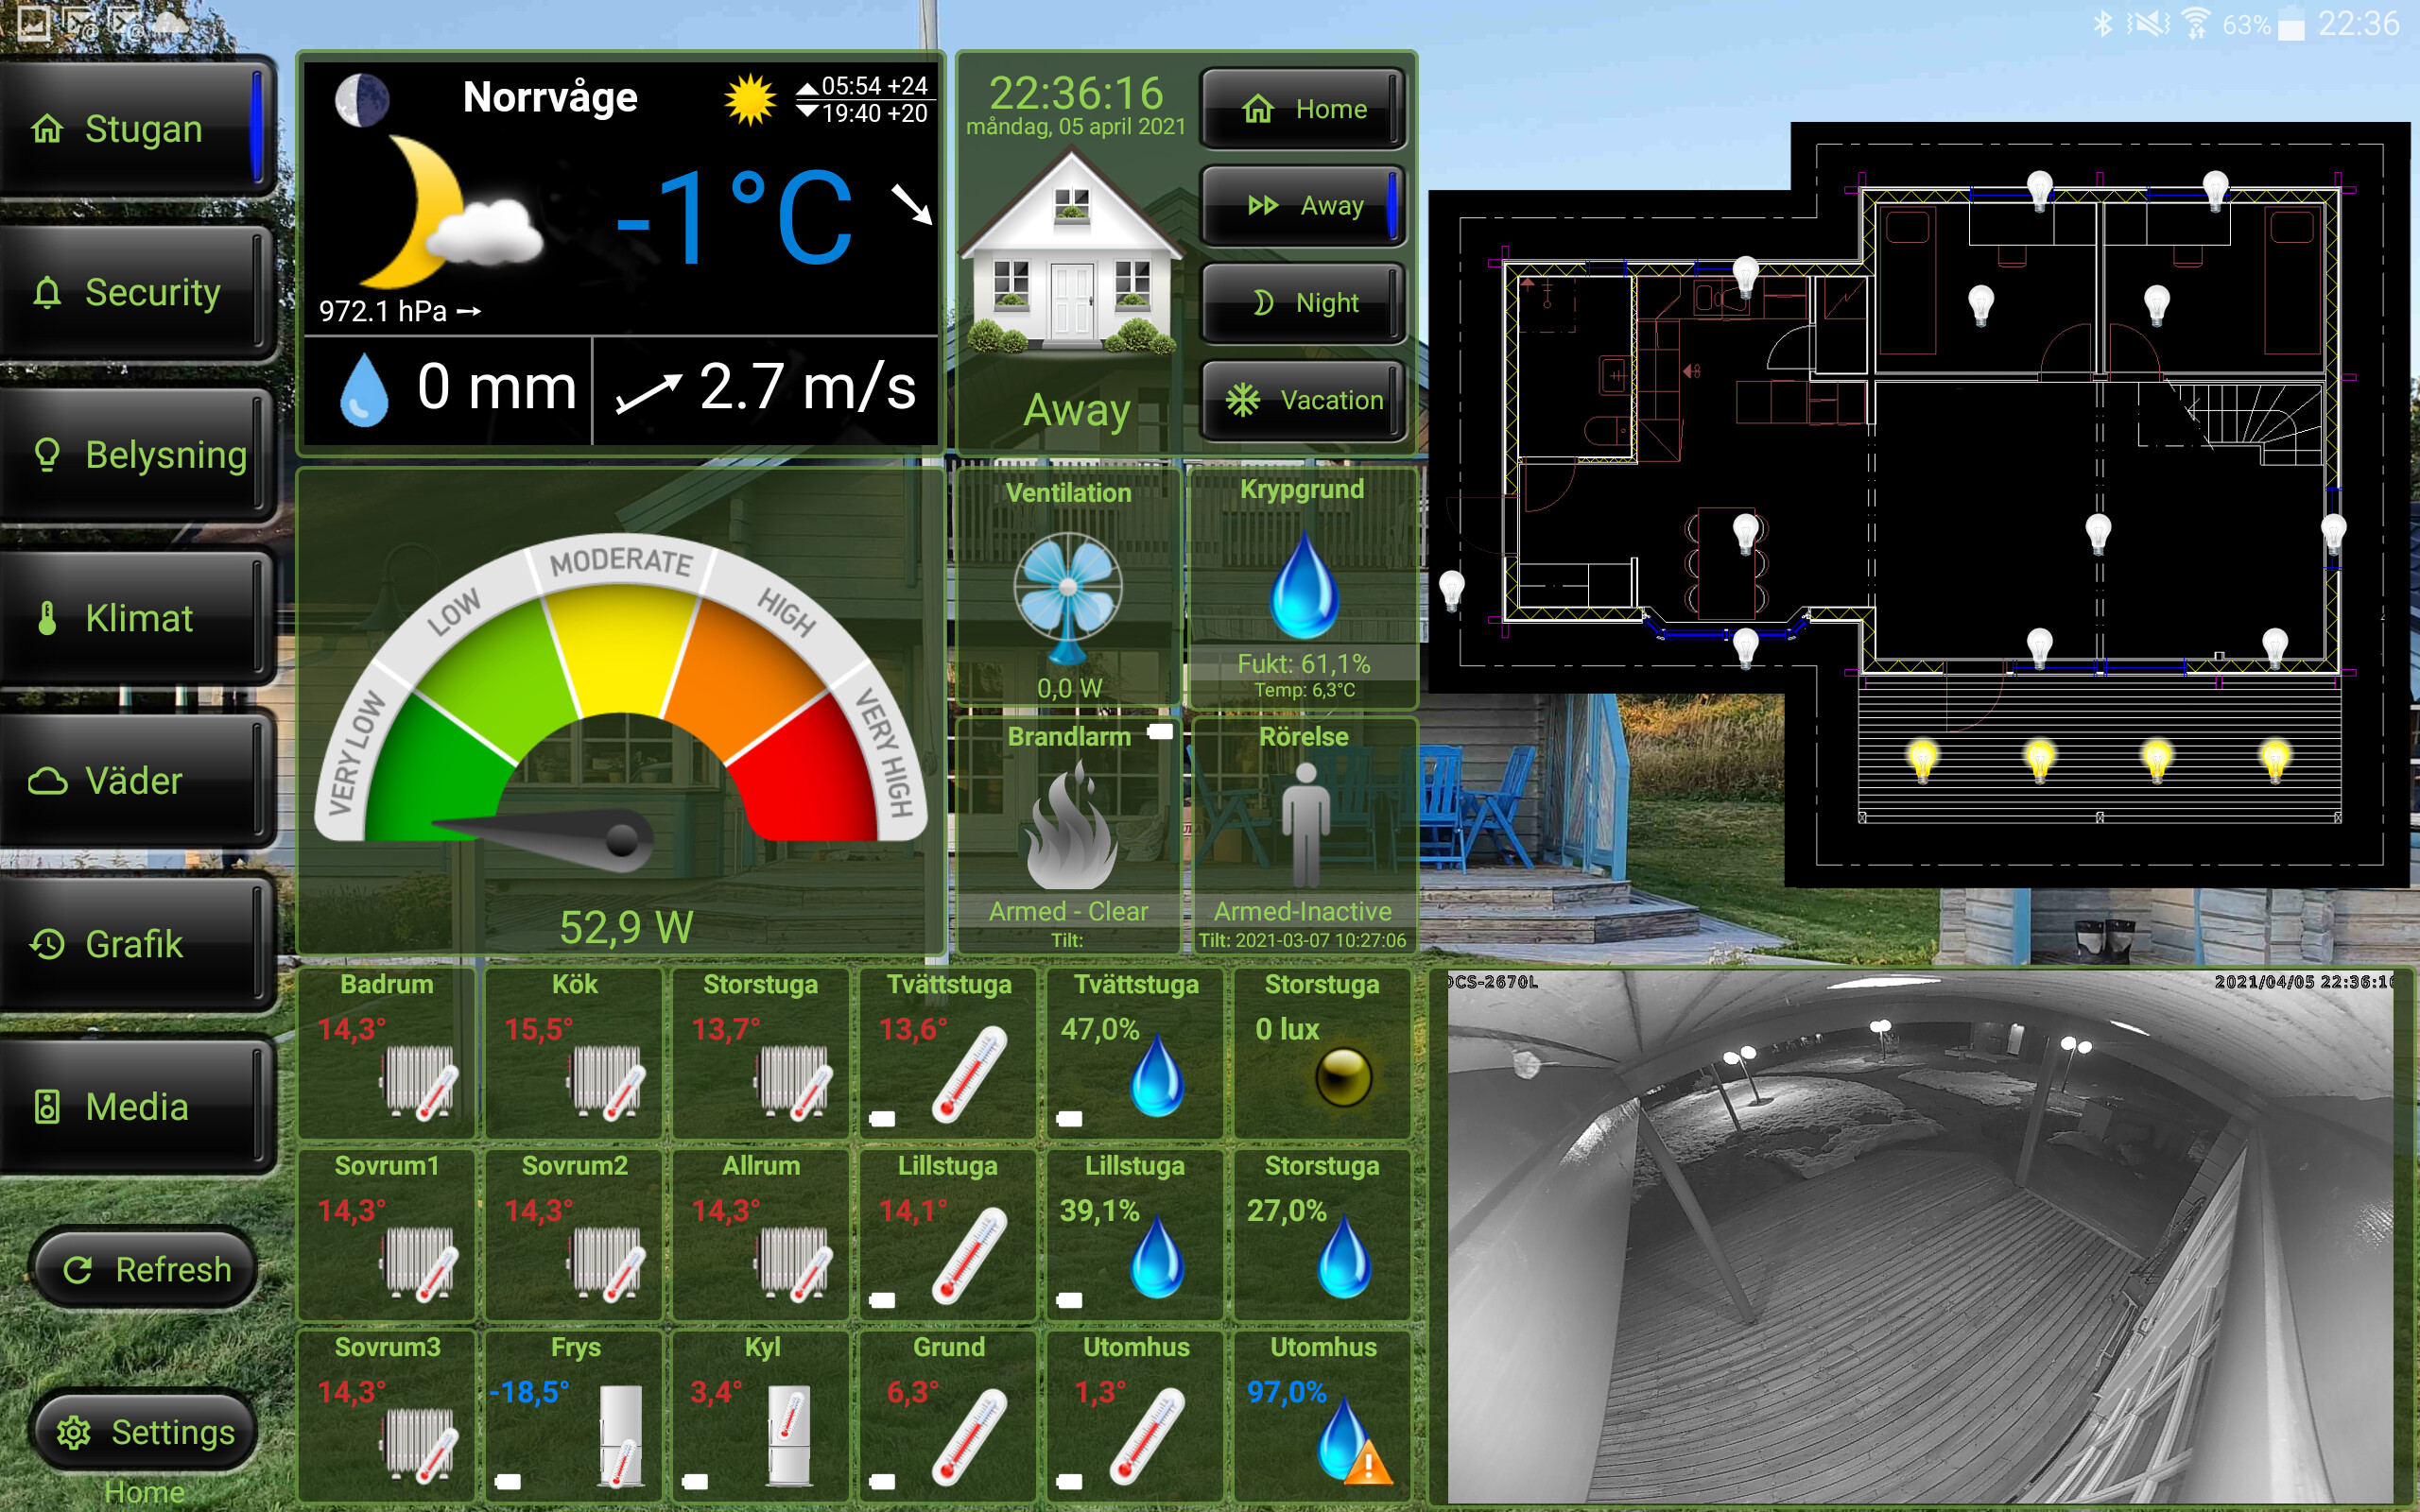
All these are running throught @device binding. One issue are that even though the the Vera device and the data channel have same id, they are different devices. I have worked around this in my wall panel version by mixing @device binding and instance binding. On top level I have used instance binding to directly open a detail tile. Top level looks like this:
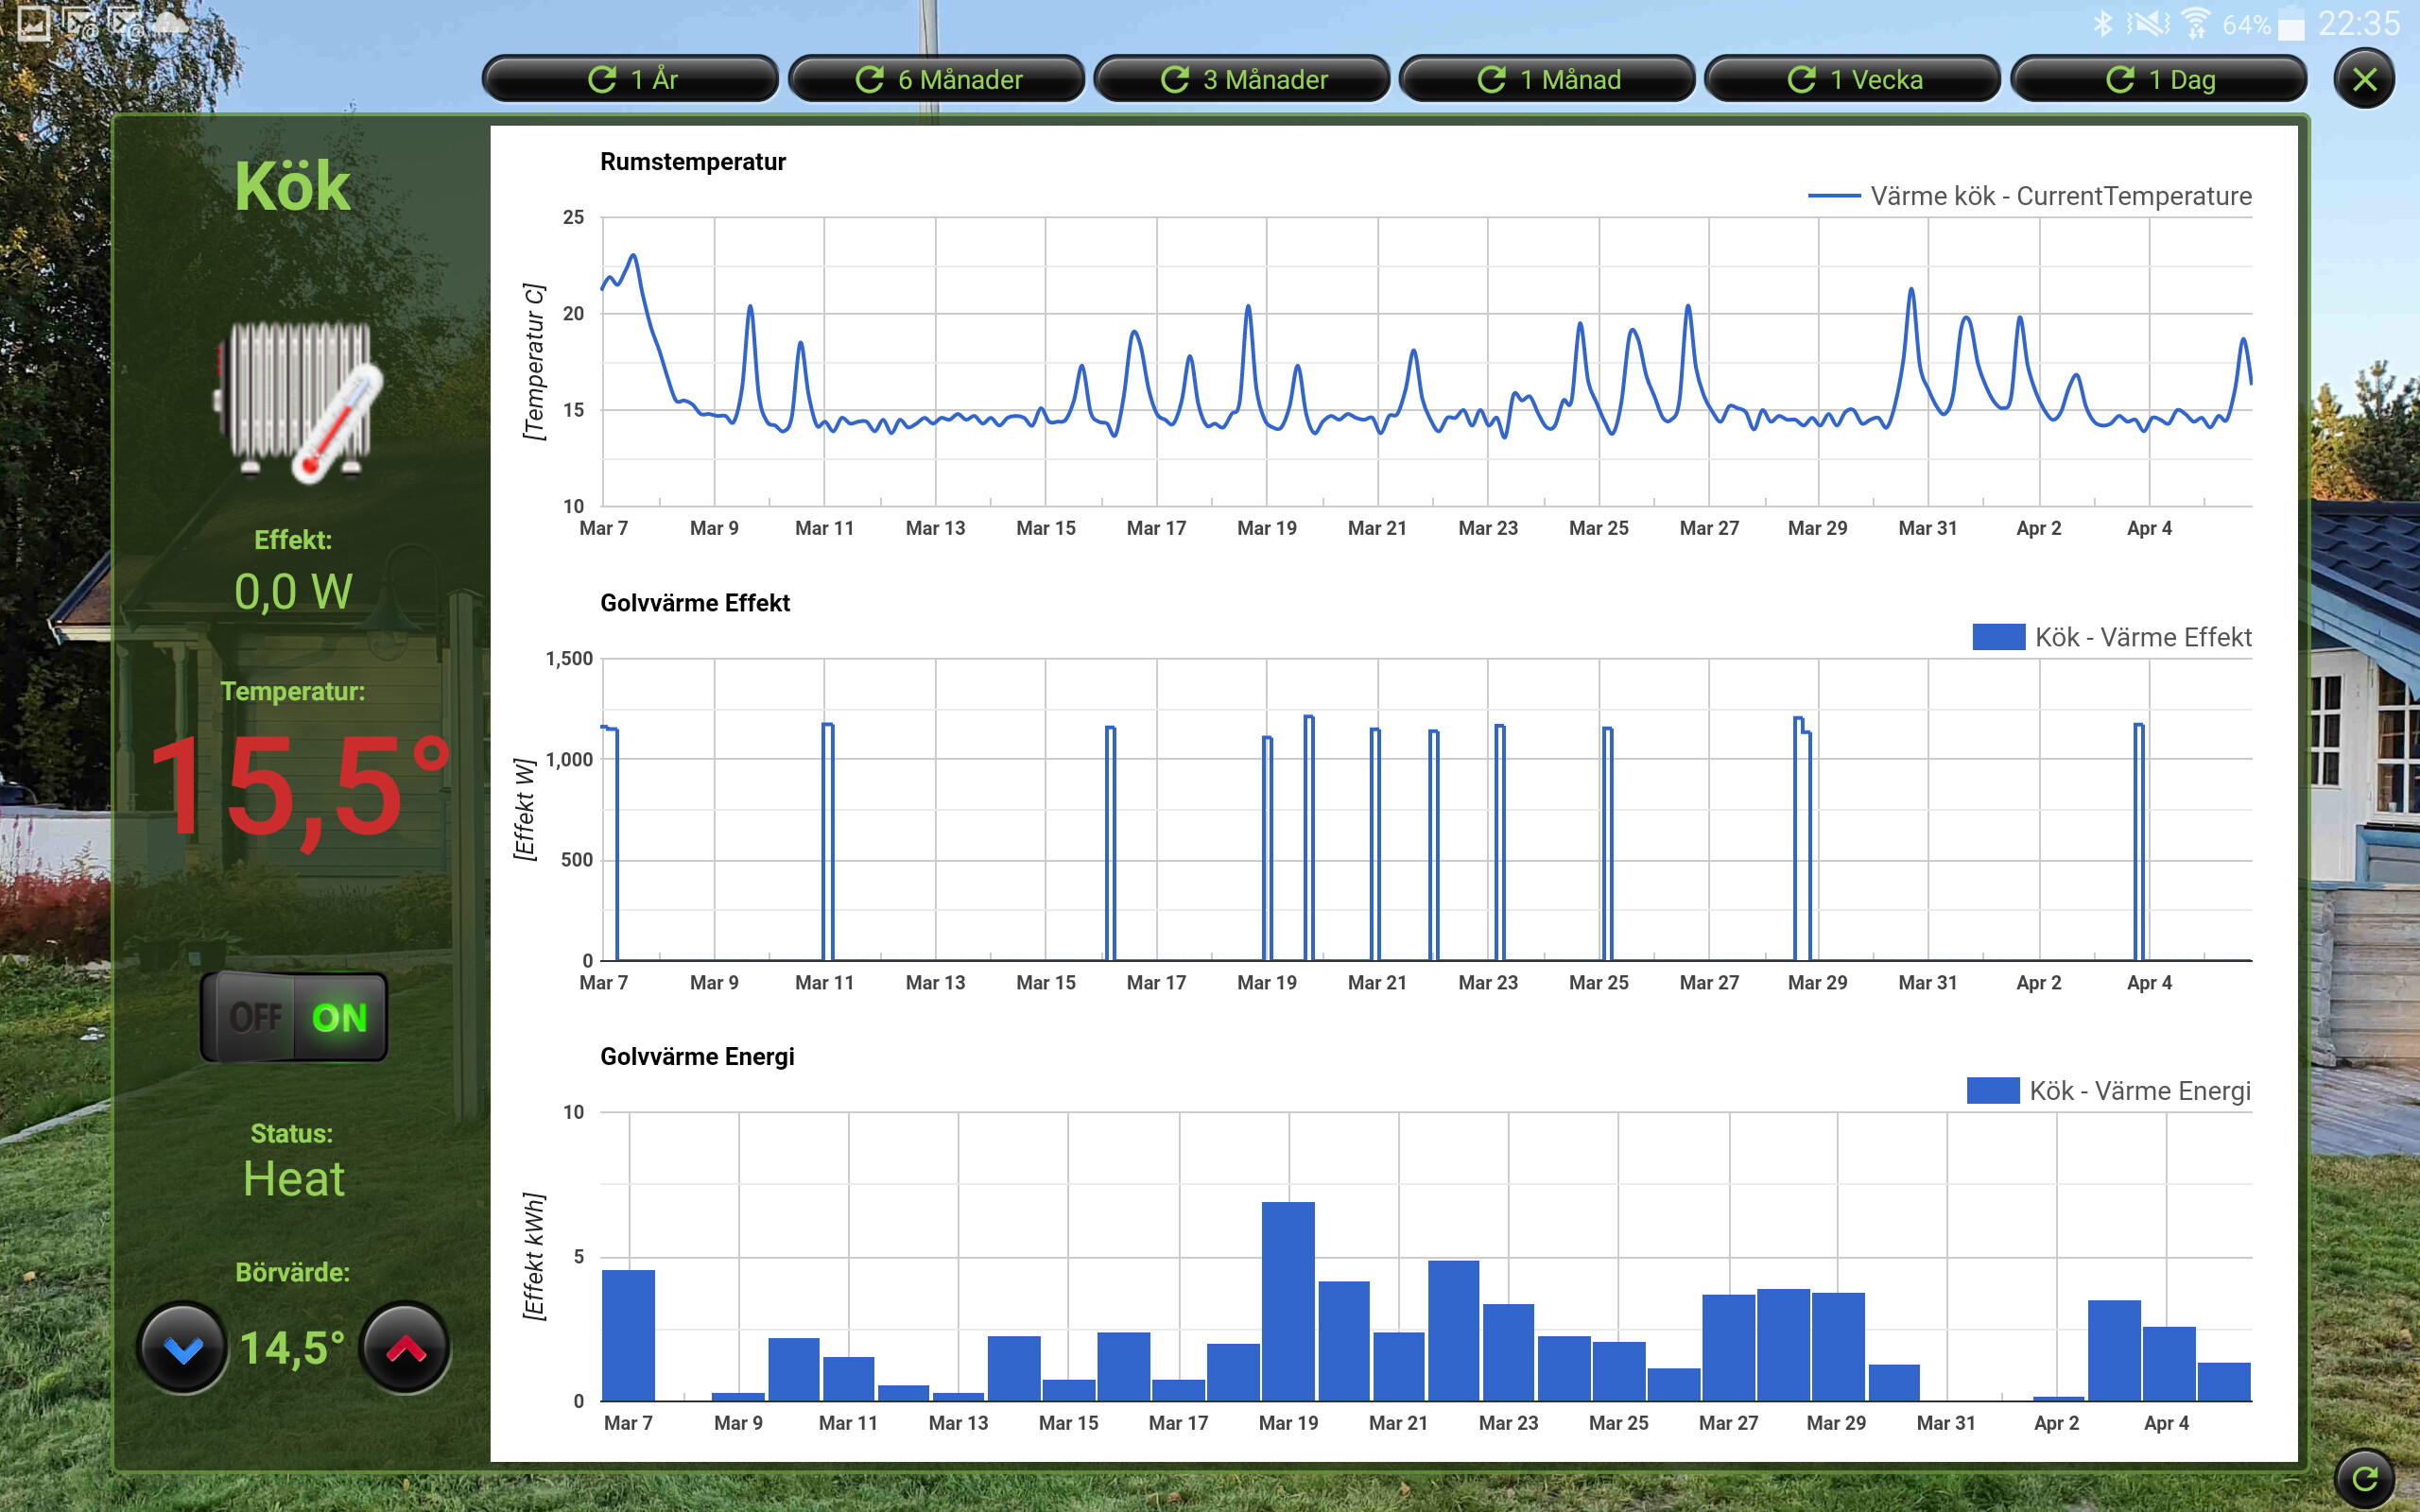
By clicking on the kitchen thermostate ("KöK in swedish…), the combined device details and charts (temp, power and energy) are open:
Clicking the power meter, an aggregated energy chart is viewed.

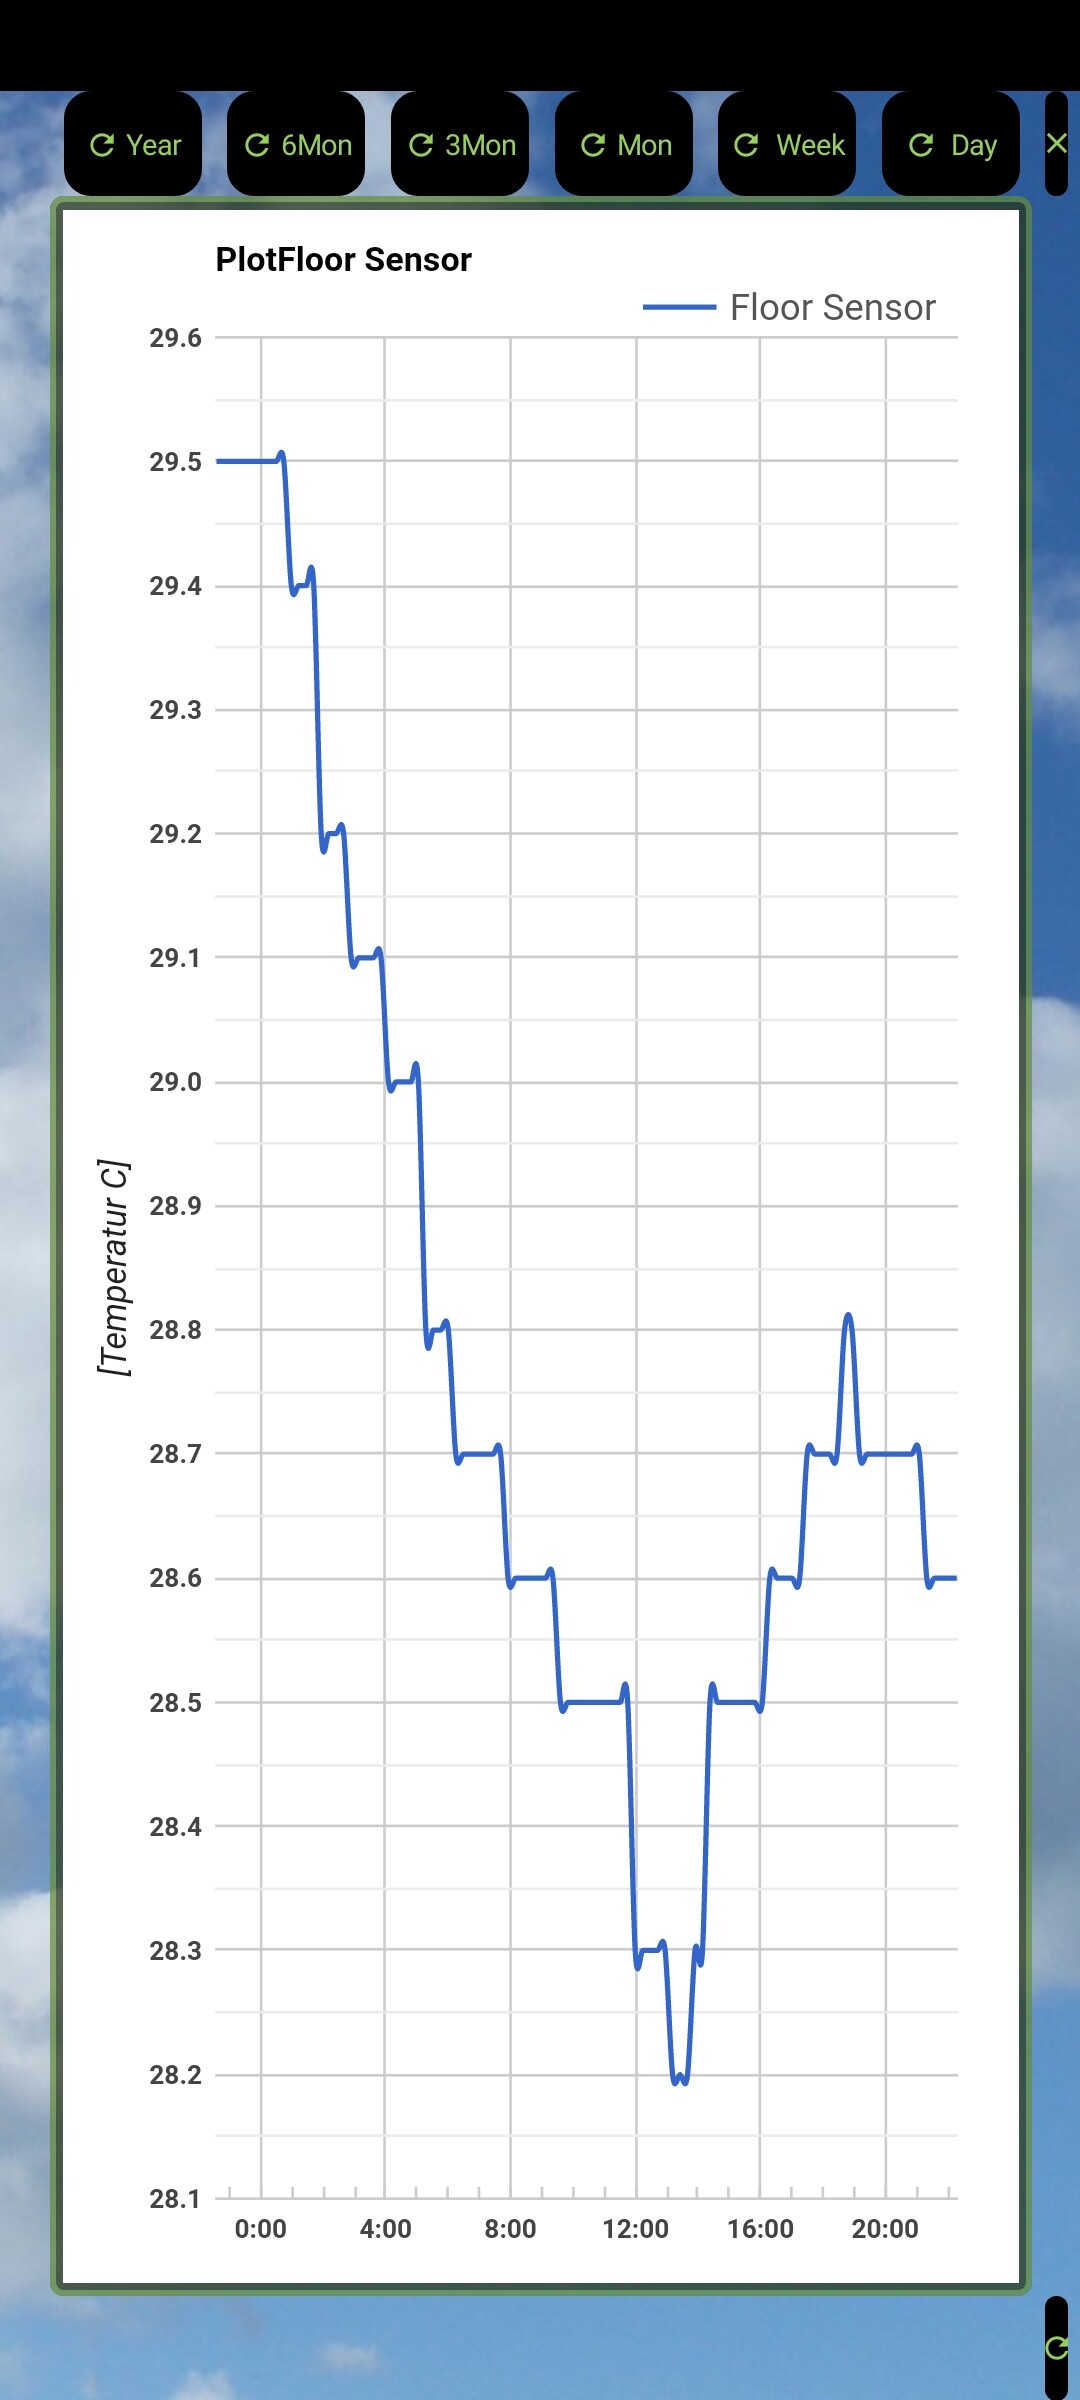
In the top of the chart screens, the chart can be scaled in time though buttons.
Also by using larger tile dimensions, a chart page using groups can also be used:
The plugin uses Google Chart to generate the plots and are viewed in THR’s web browser. HTML binding is done in the XAML file.
Datamine.betaV1.00.hrp (642.1 KB) Vera-Datamine.betaV1.00.plugin (38.4 KB)
Hope this is good enough to get the plugin running…