
This topic idea came out of a discussion I had with Bill and he suggested I put it in its own topic. For those developing plugins (whether starting from scratch or just making some “minor” modifications for your specific system), it is often help to have debugging output. This allows you to trace when plugin callbacks are invoked and to access the internal state of the plugin (values of variables, functions being invoked, etc).
One easy way to get debugging output is by using the builtin console.log() facility, which will let you print a string into the log of the HR Designer. Many of the published plugins take this approach and it may be all that is needed in many cases. One potential drawback is that the log output is only available in the simulator of the Designer. When your HRP is loaded onto a device, these messages are suppressed/inaccessible. For many, that may not be a problem.
Both because I tend to make a lot of mistakes (and thus often want a lot of debugging output to dig through to see what is going on) and because the theater I control with my Home Remote is in my basement and my development machine is upstairs (and I don’t like running up and down the stairs all the time), I wanted a mechanism to access debugging information whether in the simulator or the app. I use the debugLog() function below in my plugins rather than console.log(), although it behaves in a similar manner.
In order to make use of debugLog(), you need to make a 3 minor changes to your plugin. First , you need to declare the following global variables:
var VERSION = "Plugin Version Number";
var debug = true;
var LOG_MAX = 5000;  // maximum size of the log in characters; set to 0 for unlimited
var LOG_TRIM = 500;  // when maximum size reached, trim the log plus this much more so not constantly trimming
-
VERSIONis just a string to track the version number of your plugin. I just use the date, but the format doesn’t matter at all. -
debugis a flag that let’s you globally turn on/off the debugging output. If set to false, no messages will be generated. -
LOG_MAXandLOG_TRIMare used to control the size of the contents of thedevice.Logattribute so that it doesn’t get enormous. If you setLOG_MAXto 0, the log will not be trimmed.
Second, you need to include the debugLog() function itself:
function debugLog(s) {
    // Logs a string to both the console and the device Log attribute
    //  because the console is not available in the app.  It can also
    //  trim the device Log to keep it from growing too large if
    //  LOG_MAX is not 0.
    if(debug) {
        var device = plugin.Devices[plugin.Name];

        // is this the first time through?
        if(device && !device.Log) {
            // log is empty, so start it off with version info
            var verstr = plugin.Name + ": version " + VERSION;
            console.log(verstr);
            device.Log = verstr + "\n";
        }

        var logstr = plugin.Name + ": " + s;

        // send it to the console
        console.log(logstr);

        // send it to the device log
        if(device && device.Log) {
            device.Log += logstr + "\n";

            // trim the log if necessary
            if(LOG_MAX && (device.Log.length > LOG_MAX)) {
                device.Log = device.Log.slice(-(LOG_MAX + LOG_TRIM));
            }
        }
    }
}
Third , you need to add the “Log” Attribute to your device object. I do this through onSynchronizeDevices() with:
device.Attributes = [ "Log" ];
But if you already have the device object created, you could also just select the device object under “Devices” and in the “Properties” pane, add “Log” to the Attributes:
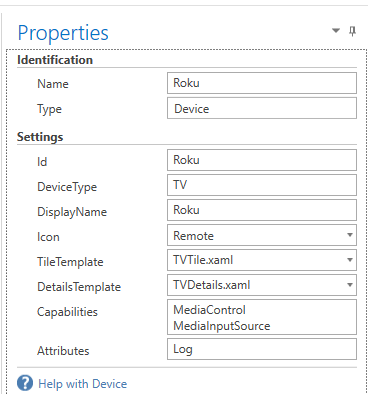
Once you have done this, just use debugLog() instead of console.log() in your plugin and the logged messages are available through device.Log, which you can bind like any other device attribute. I built an interface in my remote to access the Logs for several of my plugins using a Page Browser and a Label:
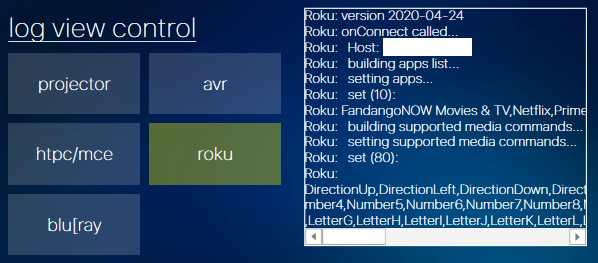
Although it doesn’t show a vertical scroll bar, you can scroll it vertically as well. It has worked fairly well for me, especially when experimenting with different ways of sending commands and trying to observe the effect it has on the devices.
I hope this is helpful. In the interest of keeping my own published plugins clean, I’m probably (haven’t completely decided yet) going to strip most of the debugLog() functionality and just have it be a wrapper for console.log(), but in my own setup, I keep it live in all of my plugins. I like to be able to see the version information and confirm that the plugin is communicating correctly.
I’m interested in what other debugging techniques people use–I’ve refined this code over several iterations already and I’m sure there are more features/capabilities I could add to it. Happy to answer any questions or clarify anything above. Hope you find it useful!
HFN