
I am just another one finding a replacement for Imperihome towards a Vera and so far HR does a good job. One thing I use a lot in the Imperihome is the capabillity to show Datamine 2 graphs. I have graphs in the tiles and also when clicking a tile, I can get a full screen plot on logged data in the Datamine 2.
Is there any way to replicate this in HR?
1 Like
Graphing isn’t natively supported in the Home Remote software. If your graphs have a web interface you could perhaps use a WebBrowser control.
Have looked into the chart option and I have got the Google chart working in HR with local JSON data tables manually downloaded through standard web interface to Vera Datamine . This creates nice looking graphs in the HR WebBrowser control with the new html binding to a plugin. Remains is to get the JSON data from the Vera Plus fetched inside the plugin. Guess it should be possible to fetch this data in a similiar way as HR use to get the sdata on devices ( i.e.https://veraIP/port_3480/data_request?&id=lr_dmGoogle vs https://VeraIP/port_3480/data_request?&id=sdata).
Is there a way in a plugin to use any javascript function to re-use the HR get functionality used with the Vera Device Source property settings to make the data collection of sdata but with another id (i.e. …/port_3480/data_request?&id=lr_dmGoogle instead of …/port_3480/data_request?&id=sdata?
You will need a plugin to pull data from “lr_dmGoogle” & there is no way for the plugin to access anything from the built-in Vera integration. The 2 are completely isolated.
Have now the complete set in place to create graphs in HR from Vera Datamine2. Thanks for your guidance so far. With Google graphs it looks quite good, have tooltips and can also be made interactive.
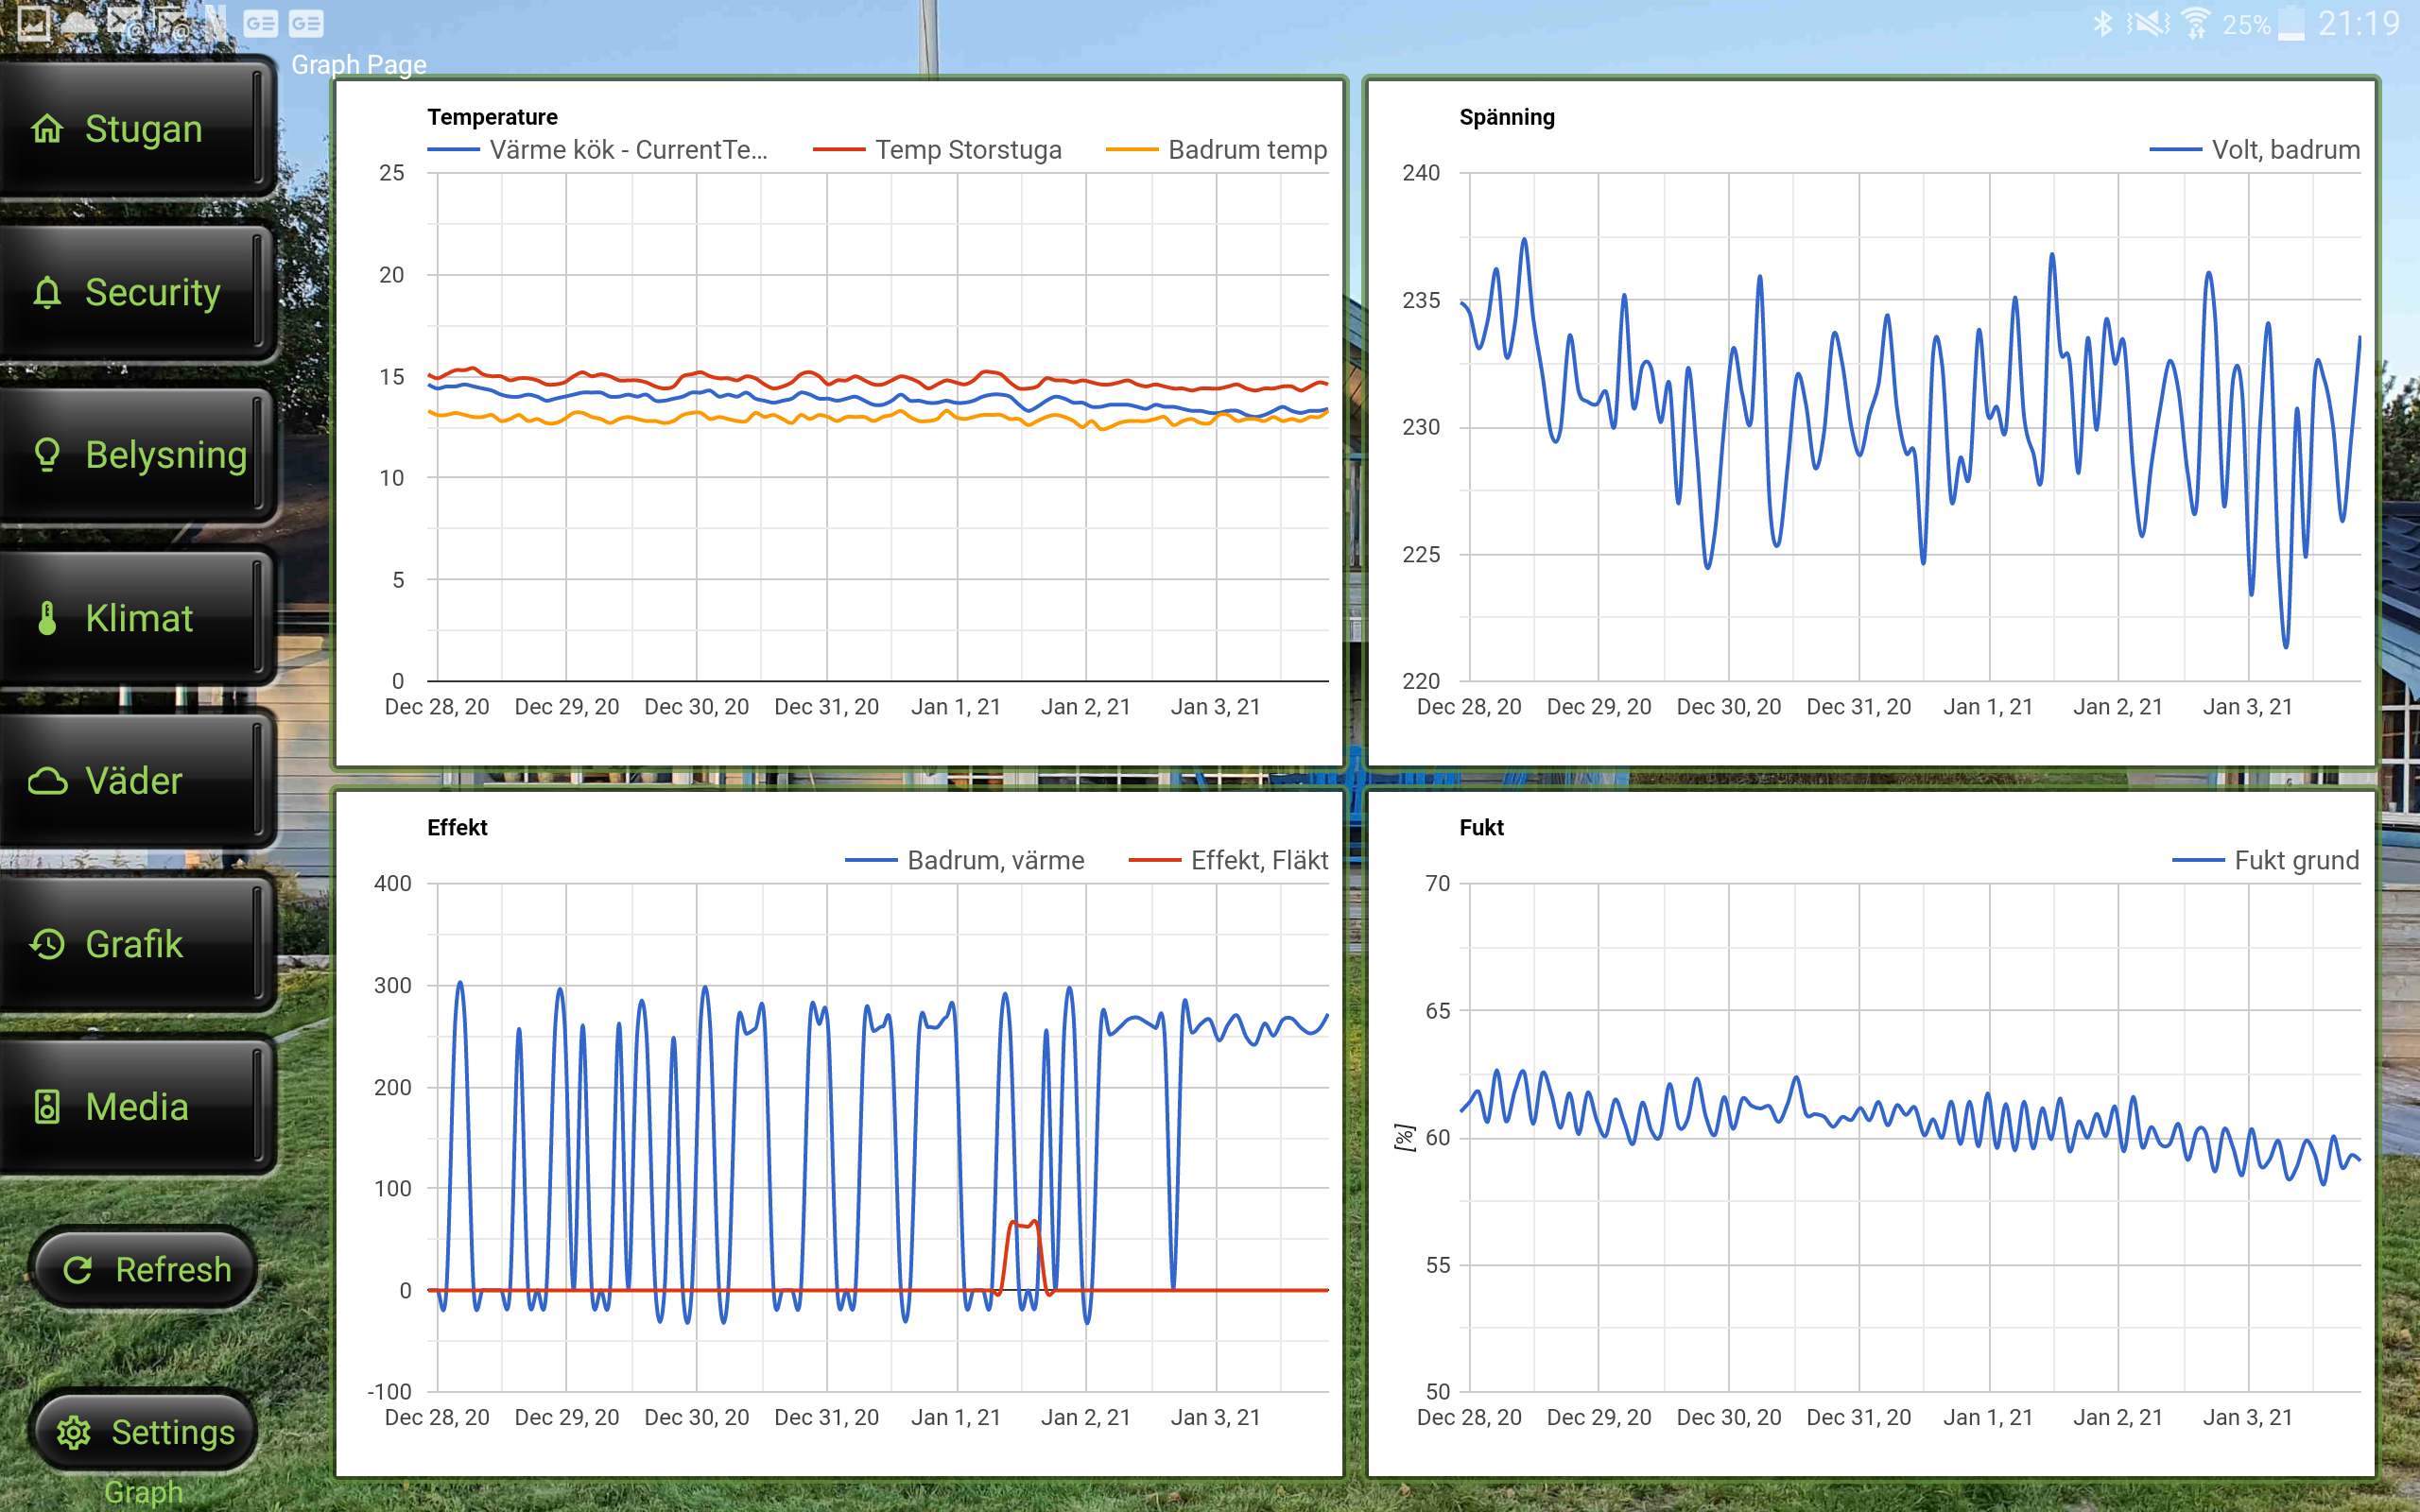
Where I am still struggling to find a working solution is from the plugin sense the width and height of the tile its displayed in. Each of the graphs in above image is displayed as HTML/SVG in WebBrowser in a tile within a DeviceBrowser with a HTML binding to @Device.out attribute. What I would like to do is to have different resolutions and size on the graph for a small tile (the device TileTemplate) and a detailed, full sized Tile (the device DetailsTemplate). Resolution needs to be set in the request for the data (amount of data for a given dataset differes with resolution). Is there any way for a plugin to sense the size of the tile it’s bind to be displayed in?
Not really. You’ll probably have to hardcode the sizes into your plugin.
This looks really great!!
I’m also a Vera user converting from Imperihome to TheHomeRemote.
Having graphs from Datamine in THR is on my wish list.
Are you willing to share your rhp file with your solution?
At the moment it’s still work in progress and most of the function is in the plugin. Syncronizing the plugin gives you graph devices for each channel defined in Datamine. Login is set as a plugin setting so should be quite portable. Hope to have all details in place within coming month. Then it should be possible to share the plugin with instruction on how to get it up and running. Best long term would be if this could become a part of the Vera HR integratation just as Imperihome offered.
1 Like
Have fixed the sizing issues so the graph width&height is set by the Tile/WebBrowser size without need to store any extra information. But I still struggling with storing data needed to the control the plot
window which don’t reside in the requested information from the device database.
I can make a request of a fixed time frame of data such as a week, but what I would like to do is control the requested time frame from a button on the tile carrying the WebBrowser with a device attribute and onChangeRequest event. Events works but I can’t find a way to store this data in a persistent way. Each time the onPoll function runs, the stored variable carrying the plot range is always blank.
Is there a way that the plugin can keep state variables on devices (like a device have selectable time frame as a plotRange of Day, Week, Month or Year) between each time the onPoll function runs?
Do you mean onConnect/onDisconnect?
Devices are only reset when disconnected. Devices are not reset between onPoll calls. If you would like to persist certain variable values you can create a local store in your plugin.
Here’s an example that shows saving the switchState to a local variable so it can be restored in onConnect.
plugin.Name = "VirtualDeviceExample";
plugin.OnChangeRequest = onChangeRequest;
plugin.OnConnect = onConnect;
plugin.OnDisconnect = onDisconnect;
plugin.OnPoll = onPoll;
plugin.OnSynchronizeDevices = onSynchronizeDevices;
plugin.PollingInterval = 1000;

var switchState;

function onChangeRequest(device, attribute, value) {
    switch (attribute) {
        case "Switch":
            switchState = value;
            device.Switch = value;
            break;
        default:
            break;
    }
}

function onConnect() {
    console.log("connected");
    plugin.Devices["1"].Switch = switchState;
}

function onDisconnect() {
    console.log("disconnected");
}

function onPoll() {
    console.log("polling");
}

function onSynchronizeDevices() {
    var virtualSwitch = new Device();
    virtualSwitch.Id = "1";
    virtualSwitch.DisplayName = "Virtual Switch";
    virtualSwitch.Capabilities = ["Switch"];
    virtualSwitch.Attributes = [];
    plugin.Devices[virtualSwitch.Id] = virtualSwitch;
}
Aha - think the connect/disconnect is the key here…Wasn’t thinking that variable was only persistent from connect to next disconnect but that feels natural. Will check this but very likely this is the answers. Thanks for quick feedback 
Just to confirm that you where spot on with disconnect/connect. It’s know working as it should and plot ranges works perfect.
Hi @ojto. When are you ready to share this plugin, I’m very interested in this and would really appreciate it. It’s the last important feature in Imperihome that I still miss in TheHomeRemote
Hi Wilbert. I have spent the last 3 weeks testing my vera remote datamine setup with good and stable results. So this function seems well under control and I can replicate all graph functionality in some but not exactly the same way as Imperihome. Next step is to make the local implementation. Target is to have this tested within next 2 weeks. There is still some items on my wish list that I hope to be able to find a solution for. These are:
- Able to group channels through standard HR principles. Today each channel is the channel identified by HR in same way as a device. I would like to have a function where channels/devices can be grouped. Just like two switches should be controlled in one tile two channels should be plotted in one graph i.e have like 4 temperature sensors ending up in one graph without hardcoding it to the plugin. Can easily do it through hard coding but would like to get to a more generic implementation.
- Better handling of set parameters through the plugin settings - will make it more flexible and less hardcoding.
Think it will be a litle more time needed before it’s in my view completed. Still I think it’s would be like a beta stage level where it could be of interest to see it it would also work on a broader level even if not yet completed. Haven’t done any sharing before of a plugin, but if it would be of interest for you I could make a stab on a .hrp file that could be used for testing towards your vera datamine. If you need local access, it will take a few more weeks, with remote it would be quicker.
1 Like
Hi ojto, thanks for your reply and your efforts! I very much like to test it and give feedback but my preference is local access. Please let me know when you have this ready for testing
Ok, Local should be more straight forward as this is a local IP adress while relaying through the secure remote is quite complex… Will let you know when I have something stable tested.
Hi ojto,
sound great what you have done.
Can you already share something? As former Imperihome user I’m very interested…
Home Remote is a great app for me - and I think for many other users.
I’m ready to test and help, if I can.
Thanks!
Michael
I am still working on some fixes but I will compile a .hrp and a .plugin file so it can be tested also by others. Hope to be able to share this shortly…Can also compile some images on how it looks on my tablet.
1 Like
Plugin uploaded into the plugin category…