Hey there,
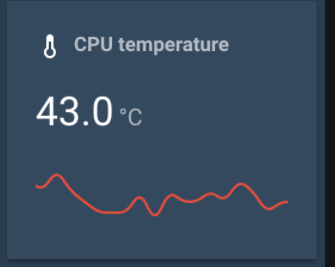
what do you think, would it be possible to build a chart that can be used with JSON Values?
I´ve seen this in other programs. They define the min & max of the chart via JSON and show an array of up to 20 Values. 
Kind regards,
CrunkFX

Hey there,
what do you think, would it be possible to build a chart that can be used with JSON Values?
I´ve seen this in other programs. They define the min & max of the chart via JSON and show an array of up to 20 Values. 
Kind regards,
CrunkFX
Notice that nobody replied here - but I wanted to do similar for energy consumption data collected from the Octopus / Kraken APIs and show it on my wall mounted tablet.
I tried to use Rectangle and Icon objects to plot a chart in a grid by adjusting height, width, margin etc. It works well in Windows with the IOS simulator but does not work on the iPad. It seems to be an issue with dynamically setting width / height and position based on device / plugin data. Solution was a non-starter.
Fallback was to use a web based charting solution and a Web Image to paint the image into a tile, this works well from a dashboard visual perspective, & will achieve what you want to achieve above - it does not support any click events on specific data points - which is what I really wanted to achieve.
Anyway - take a look at this: https://quickchart.io/chart/render/zm-e73f9fbe-dd29-484a-9494-843d36398c90?labels=Mon,Tue,Wed,Thu,Fri,Sat,Sun,Mon,Tue,Wed&data1=22.88,24.208,22.525,25.2,20.088,27.778,21.752,16.646,12.908,18.602
You can use a multi-element binding to cruft up the URL string with your data points & you can edit / customise, create your own chart (pie / line / bar etc.) as you see fit… take the short URL and add your datapoints into the query string, set it as the image source binding for your web image control. if that makes sense
Just seeing this for the first time myself. I was also going to suggest a third-party útil that will render a bitmap based on the data, that you could display as a web image, If you have a server that you can use, that would cut down on external web requests/traffic.
would be great if it was integrated with influxdb data.